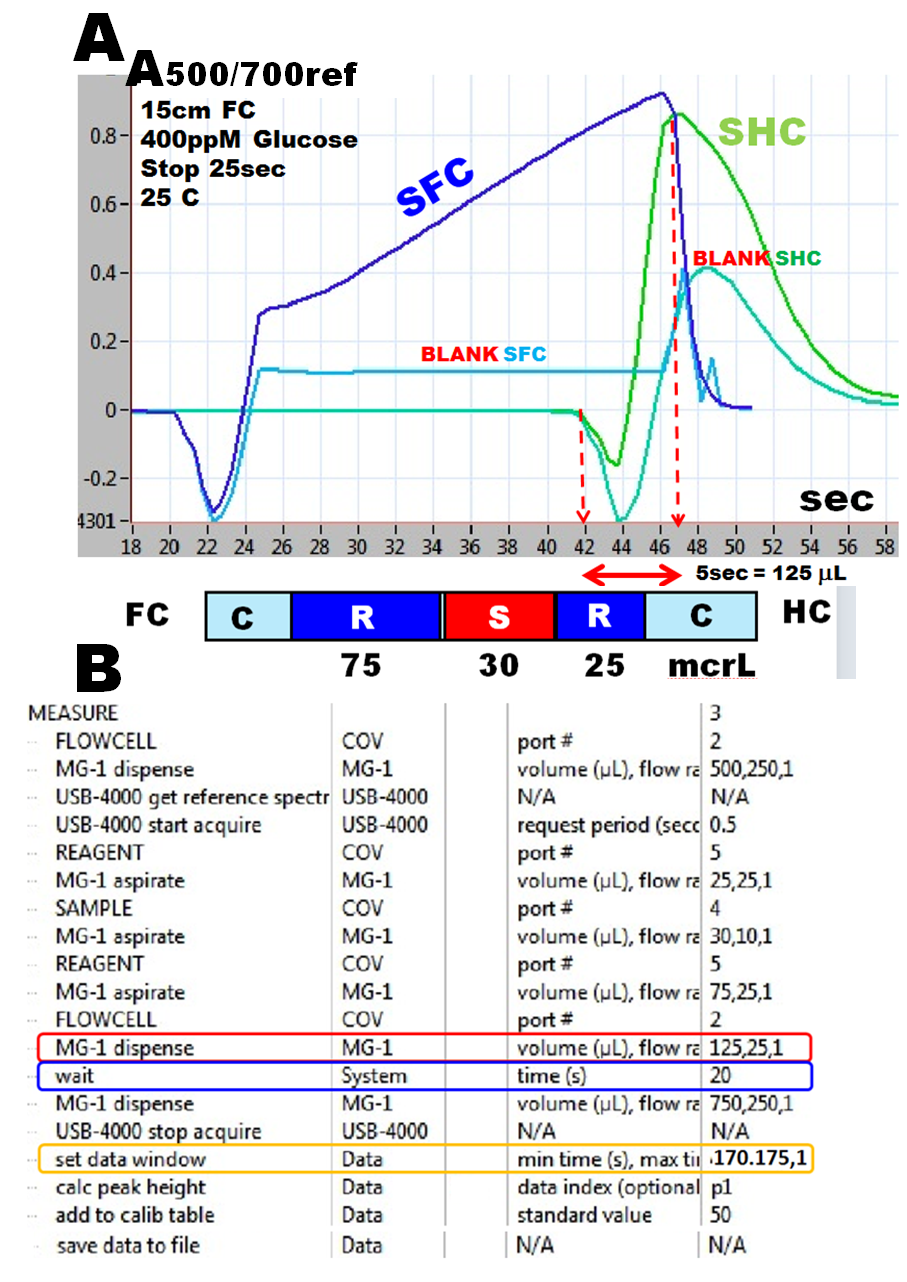
The key parameter in development of SFC method is the volume of flow reversal that will position the sample zone within the light path for stop flow measurement. This volume is identified by recording the SHC curve ( using the assay protocol from the previous page, and by measuring the time elapsed between the start of forward flow into the flow cell and SHC peak maximum. (A). This
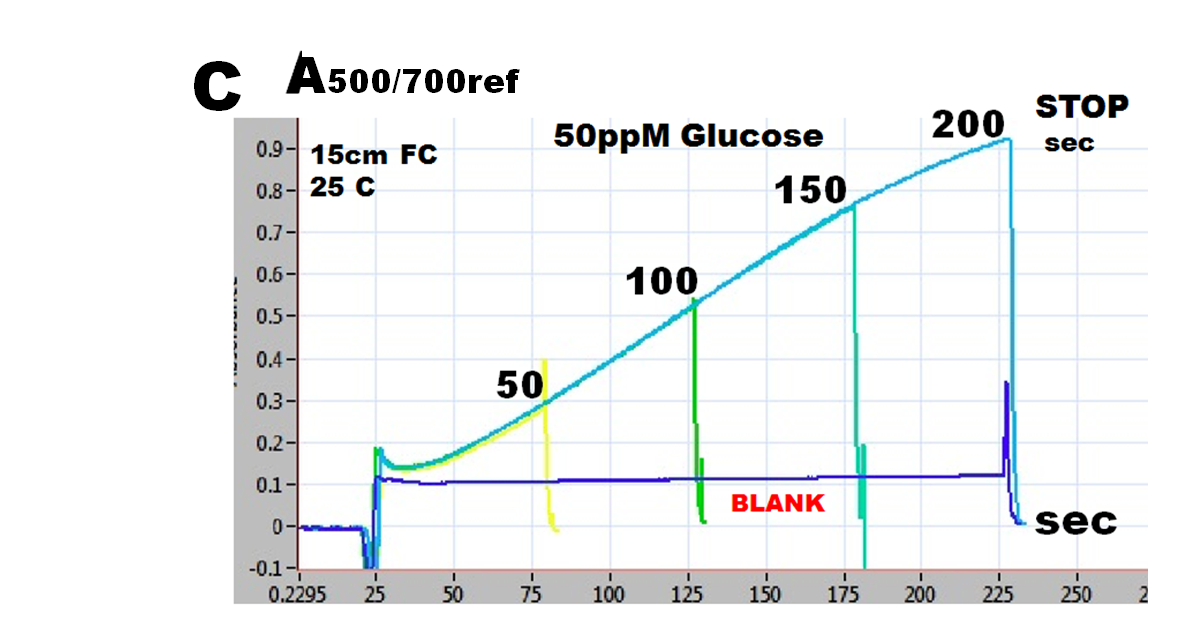
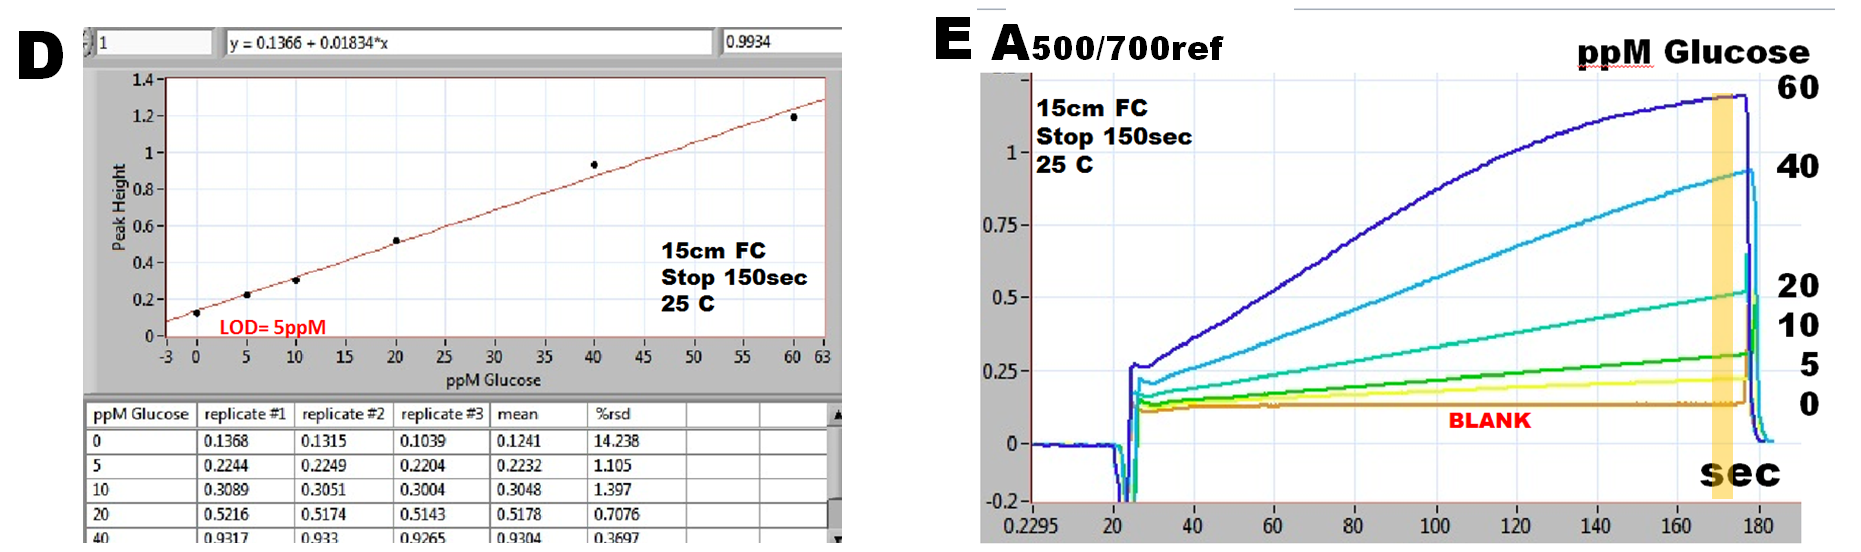
time (5 sec) yields for the applied flow rate (25mcrL/sec) flow reversal of 125 mcrL. This parameter is included in the SFC assay protocol (B)(red box), followed by a stop flow period (blue box) the duration of which is proportional to sensitivity of the assay (C). Note that the peak of SHC curve coincides with the end of SFC stop flow measurement (A). Calibration graph for 150 sec stop flow period (D), with window set at 170 sec to capture end point (yellow box) yields LOD of 5ppm glucose.


SFC Method with End Point Measurement
5 to 60ppM Glucose
2.2.11.A.